(Abstract of Visual Cost of energy facilities: A comprehensive model and case study of offshore wind farms. (2022) Landscape and Urban Planning, 220, 104314)
The visual impact assessment of large facilities can be improved thanks to Visual Impact Maps (VIMs). A VIM can be a valuable predictor (numerical and graphical) of visual effects. VIMs are conceived to help with the analysis of the Landscape professional. Even before the design stage, VIMs provide important data that complement the set of starting technical or environmental criteria, such as wind resource, land use or flood maps. Additionally, they provide a numerical model for the Visual Cost Of Energy (VCOE). A set of visual indicators and a set of visual inventory layers properly combined result in a series of VIMs: a wide collection of information that depicts the visual effect that the development of any facility generates on the considered area. The production of VIMs can result in creation of a new computational and environmental consultation service that is available along the facility life cycle and that is useful for protection, planning, and management aims.
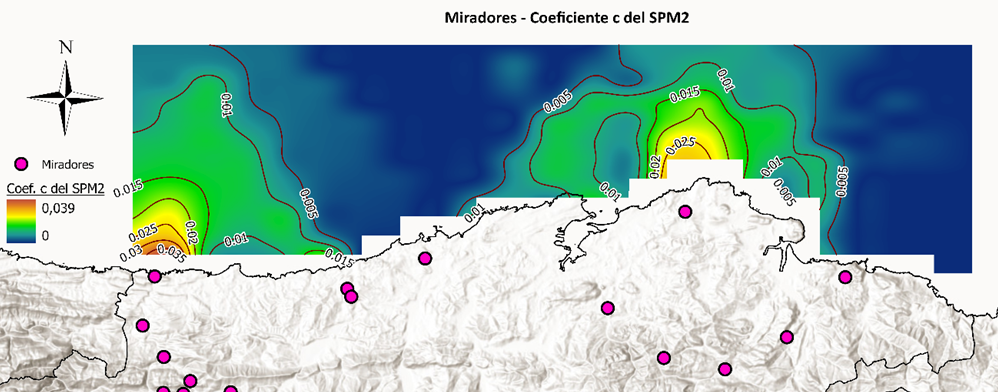
VIM for vantage points
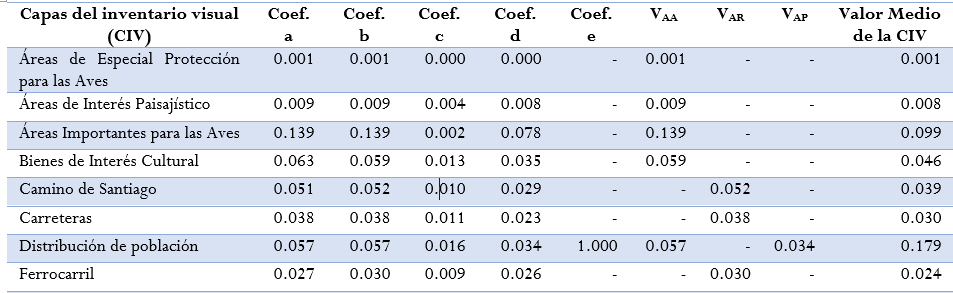
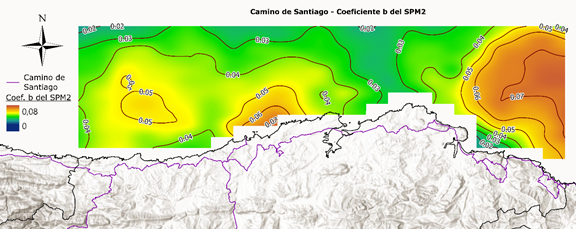
V-indicators table for visual inventory layers
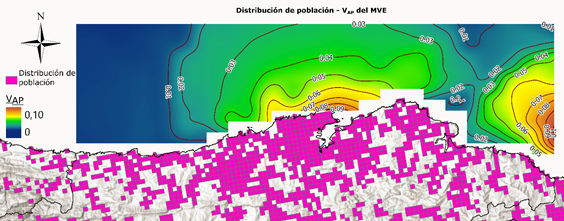
VIM for population
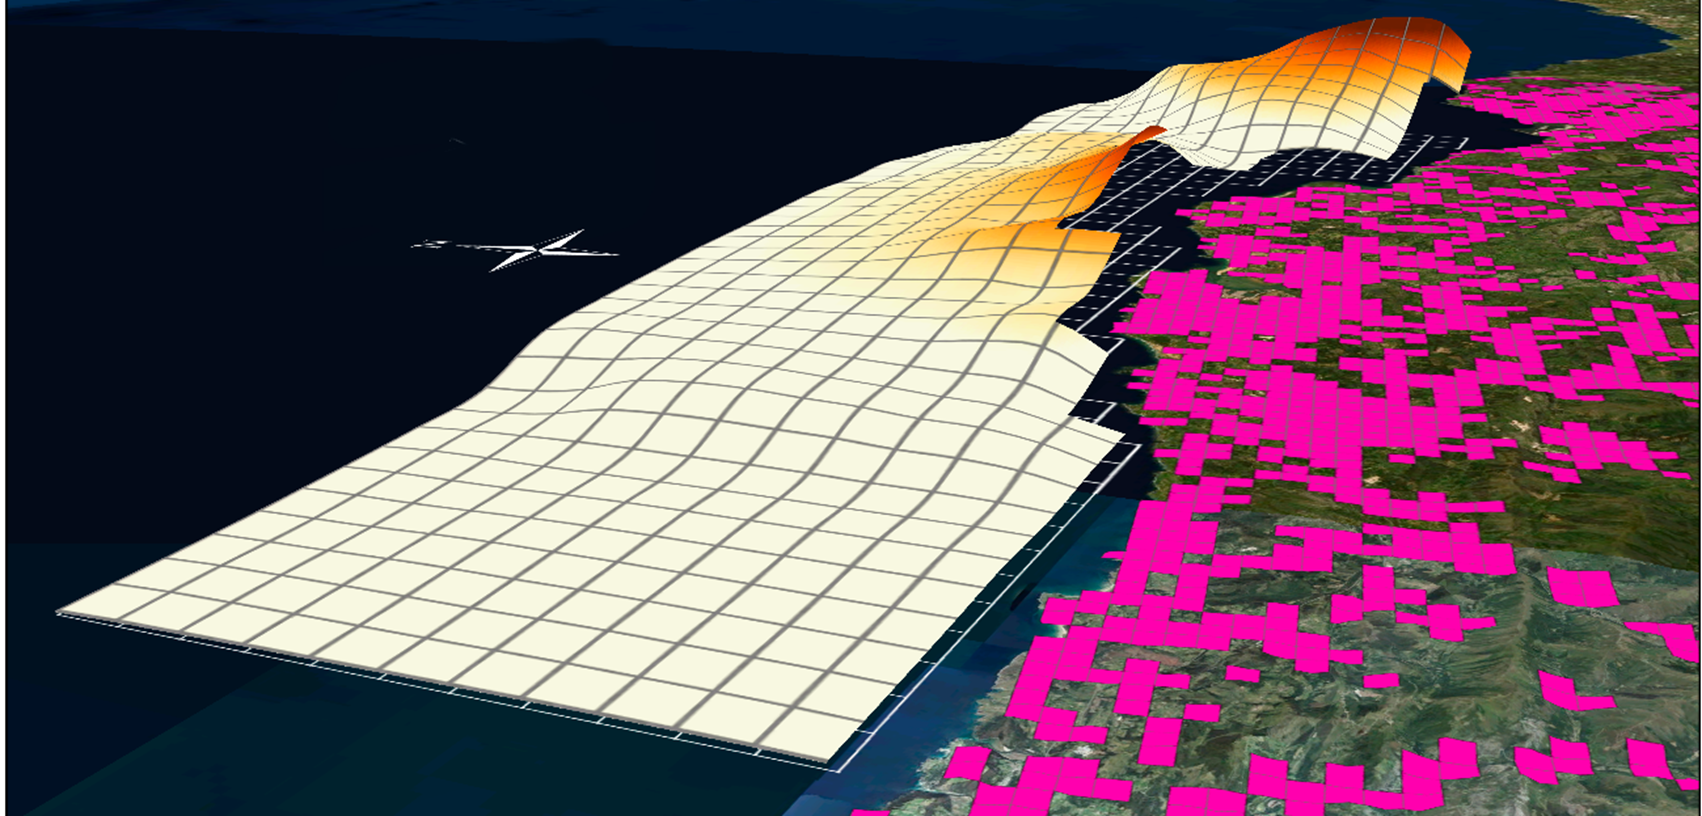
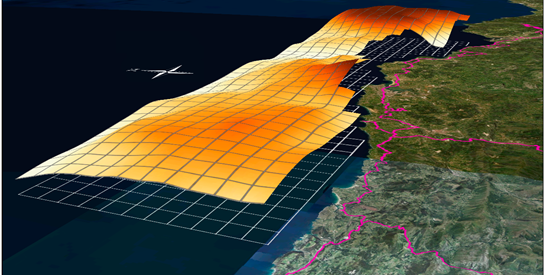
VIM 3D view for population
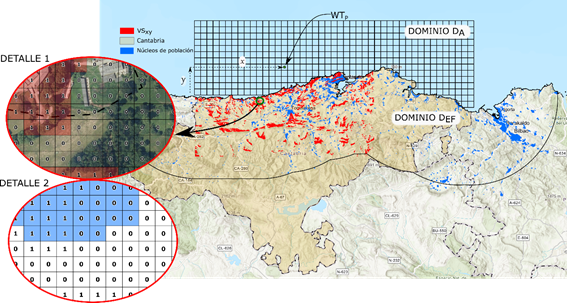
Definition of domains (land subdomain and sea subdomain)
VIM for coastal roads
VIM 3D View for coastal roads
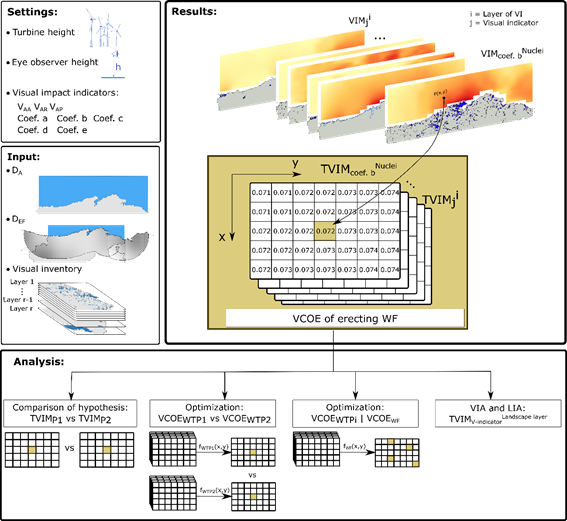
Methodology for obtaining VIMs